based on gnuplot demo file utf8.dem:
"Dump 7-bit characters and a selection of UTF-8 unicode characters"
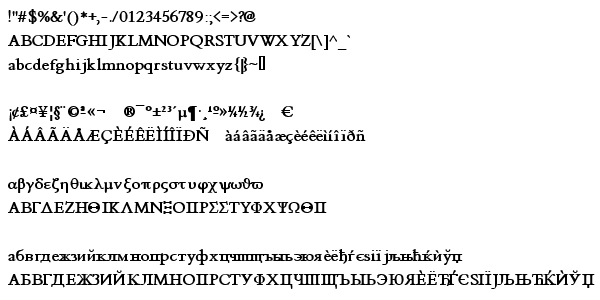
It's not difficult to mix characters of different character sets (Greek and Latin 1, for example) in a single graphic. The only requirement is to set the gnuplot terminal correctly, setting the correct font. The gnuplot source code has a demo file teaching how to do this. For example, It's possible to eliminate strange characters of graphics by adding the following font specification to ~/.Xresources:
gnuplot*font: mbfont:HelloWorld,14After adding this line, its necessary to run xrdb:
xrdb -merge ~/.XresourcesThe essential part of the gnuplot font setup is the "mbfont:" string affixed to the font specification. It tells gnuplot to request a multi byte font to X server. Of course, the X server will return nothing for such a request of "HelloWorld" font, and, then, gnuplot will try again, but this time with its default request, "*-*-r-*--14-*", which in my system matches 234 font names (according to xfontsel). The result is that gnuplot must wait about one second while the X server is looking for the correct font before it can finally display the graphic. Thus, the most precise the font specification, the faster the graphics. A disadvantage of too much precision is that it might not allow the mixing of charsets. For example, the following font specification:
gnuplot*font: mbfont:-misc-fixed-medium-r-normal--14-*is good enough to mix Greek and Latin 1 characters. In my system, it matches 28 font names. This other:
gnuplot*font: mbfont:-misc-fixed-medium-r-normal--14-110-100-100-c-70-iso8859-1matches only two font names, but it allows only the use of letters from Western European languages.
One single line in the .Xresources might be enough to solve problems of graphics displayed using the gnuplot x11 terminal. However, it's still necessary to send to gnuplot the correct parameters for the creation of png pictures. It's necessary either to set the png term with the complete path of the font that should be used or to set the environment variable GDFONTPATH. The two options below have the same effect, and works in my system:
gnuplot> set term png font "/usr/share/fonts/truetype/thryomanes/thryb___.ttf" 12
  export GDFONTPATH="/usr/share/fonts/truetype/thryomanes/"
  gnuplot> set term png font thryb___ 12
The above suggestions were tested with gnuplot 4.2.0. To know what fonts have UTF-8 support, the xfontsel utility might be helpful, although not perfect if you want to mix charsets. Probably it'll be necessary a bit of patience to discover the best fonts. The cvs version of statist is capable of converting the UTF-8 strings that are sent to gnuplot into a charset chosen by the user, and, thus, there is no need of setting up the font that gnuplot have to use. You have only to uncomment one option in the statistrc file. However, the changes in the cvs were made before the recent improvement in gnuplot source code, and the new behavior might no longer be necessary and it might be removed before the next release of statist (Let me know if you like it). A disadvantage of this conversion is that it's not possible to mix characters from different charsets.
--
Jakson A. Aquino
jalvesaq (a) gmail.com
March 2007